Tracing
Vitess tracing #
Vitess allows you to generate Jaeger / OpenTracing compatible trace events from the Vitess major server components: vtgate, vttablet, and vtctld. To sync these trace events you need an OpenTracing compatible server (e.g. Jaeger). Vitess can send tracing events to this server in the Jaeger compact Thrift protocol wire format which is usually UDP on port 6381.
Configuring tracing #
The first step of configuring tracing is to make sure you have tracing collectors properly setup. The tracing collectors must be located where they can be reached from the various Vitess components on which you want to configure tracing. We will not cover the entire setup process in this guide. The guide will cover the minimal config for testing/running locally, using the Jaeger docker container running on localhost. You can read more about Jaeger here.
Running Jaeger in docker #
You can follow the Jaeger getting started documentation here. In essence you need to run the Jaeger docker container:
$ docker run -d --name jaeger \
  -e COLLECTOR_ZIPKIN_HTTP_PORT=9411 \
  -p 5775:5775/udp \
  -p 6831:6831/udp \
  -p 6832:6832/udp \
  -p 5778:5778 \
  -p 16686:16686 \
  -p 14268:14268 \
  -p 14250:14250 \
  -p 9411:9411 \
  jaegertracing/all-in-one:1.20
Note that you don't need to expose all these ports, Vitess only cares about port 6831 (the UDP compact Thrift Jaeger protocol listener). You will also need port 16686 for the Jaeger web UI to browse the spans reported.
Configuring tracing for vtgate, vttablet and vtctld #
Now that you have the Jaeger server running, you can add the necessary startup options to vtgate, vttablet and vtctld. This will enable you to send trace spans to the server. The command line options for doing this are the same across vtgate, vttablet and vtctld. Add the following options for a tracing agent running on the localhost:
--tracer opentracing-jaeger --jaeger-agent-host 127.0.0.1:6831 --tracing-sampling-rate 0.0
There are a few things to note:
- There are other tracing plugins and the
-traceroption allows you to select them. Currently we haveopentracing-jaegerandopentracing-datadog. Onlyopentracing-jaegeris covered in this document. --jaeger-agent-hostshould point to thehostname:portorip:portof the tracing collector running the Jaeger compact Thrift protocol.- The tracing sample rate (
--tracing-sampling-rate) is expressed as a fraction from 0.0 (no sampling) to 1.0 (100% of all events are sent to the server). In the example, this option is set to zero, because we will be passing custom span contexts to the queries we want to trace. In this way, we only instrument the queries we want. This is recommended for large installations because it is typically very hard to organize and consume the volume of tracing events generated by even a small fraction of events from a non-trivial production Vitess system. However, if you just want events to flow automatically without you having to instrument queries, you can set this to a value other than0.0and skip the following section on instrumenting queries.
After adding these options, you must restart the Vitess components in question.
Instrumenting queries #
Now that you have the Vitess components setup, you can start instrumenting your queries to choose which queries (or application actions) for which you want to generate trace events. This is obviously an application-specific process, but there are a few things to note:
The
SpanContextid you have to instrument your Vitess queries with, in order for them to generate trace events, has a very specific format. It is recommended to use one of the Jaeger / OpenTracing client libraries to generate these for you. They take the format of a base64 string of a JSON object that, at it simplest, looks something like this:{"uber-trace-id":"{trace-id}:{span-id}:{parent-span-id}:{flags}"}Note the very specific format requirements in the documentation. Because of these requirements, it can be tiresome to generate them yourself, and it is more convenient to use the client libraries instead.
Once you have the
SpanContextstring in its encoded base64 format, you can then generate your SQL query/queries related to this span to send them to Vitess. To inform Vitess of theSpanContext, you need to use a special SQL comment style, e.g.:/*VT_SPAN_CONTEXT=<base64 value>*/ SELECT * from product;There are additional notes here:
- The underlying tracing libraries are very particular about the base64 value, so if you have any formatting problems (including trailing spaces between the base64 value and the closing of the comment); you will get many warnings in your
vtgatelogs. - When testing with, for example, the
mysqlCLI tool, make sure you are using the-c(or--commentsflag), since the default is--skip-comments, which will never send your comments to the server (vtgate).
- The underlying tracing libraries are very particular about the base64 value, so if you have any formatting problems (including trailing spaces between the base64 value and the closing of the comment); you will get many warnings in your
Inspecting trace spans in the Jaeger web UI #
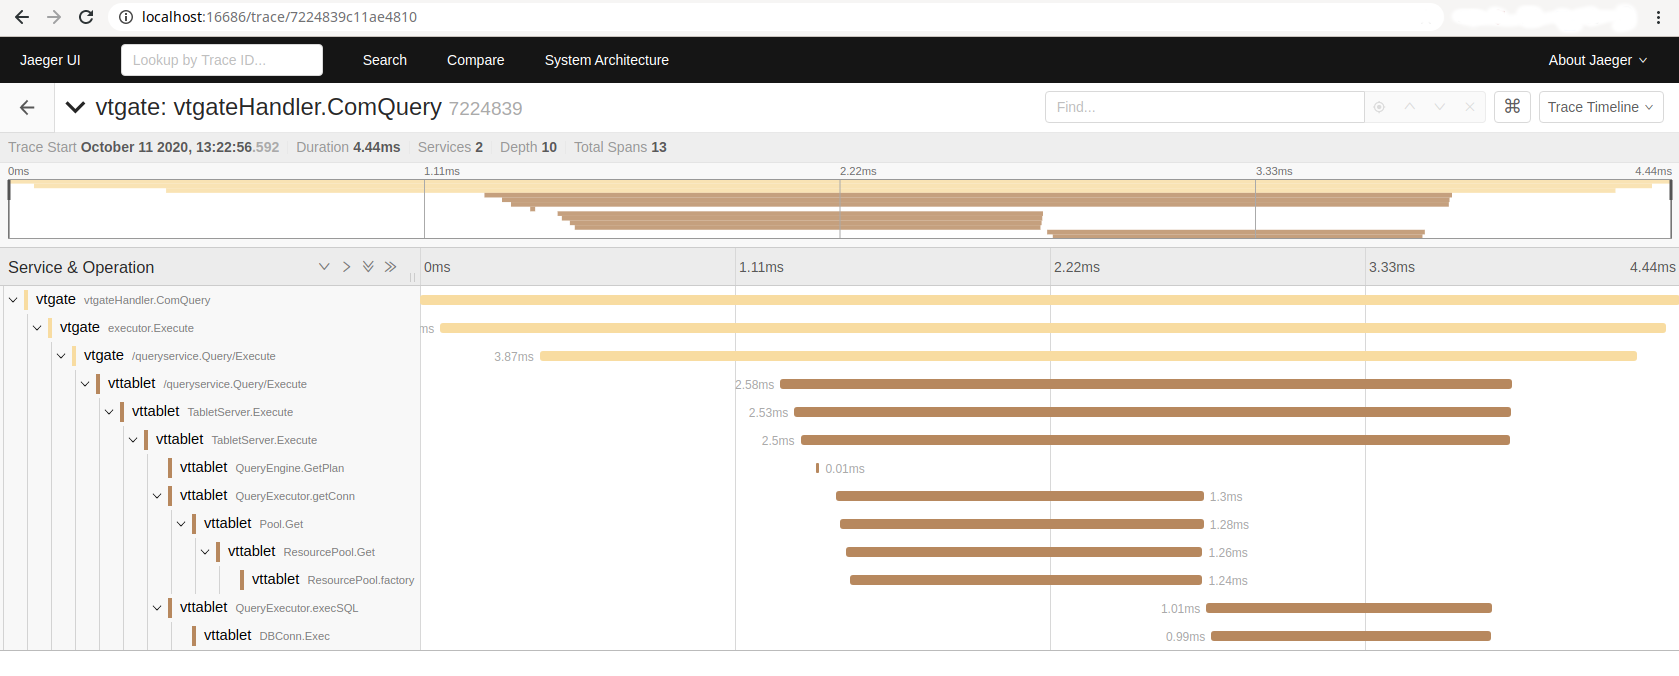
This is beyond the scope of this guide. However, in general, if you have set everything above up correctly and you have instrumented and executed some queries appropriately, you can now access the Jager web UI to look at the spans recorded. If you are using the local docker container version of Jaeger, you can access the web UI in your browser at http://localhost:16686/.
You should be able to search for and find spans based on the trace-id or span-id with which your query/queries were instrumented. Once you find a query, you will be able to see the trace events emitted by different
parts of the code as the query moves through vtgate and the vttablet(s) involved in the query. An example would look something like this: