Benchmarking is a critical technique for delivering high performance software. The basic idea behind benchmarking is measuring and comparing the performance of one software version against another. Over the years, many benchmarking techniques have emerged, but we can broadly separate them into two categories: micro and macro benchmarks. Micro-benchmarks measure a small part of the codebase, usually by isolating a single function call and calling it repeatedly, whereas macro-benchmarks measure the performance of the codebase as a whole and run in an environment similar to what end-users experience. These two categories of benchmarks are analogous to unit tests and end-to-end tests.
Vitess is a critical part of the infrastructure of many large companies, and because of the impact that Vitess' performance has on real world adoption for our database, the Vitess team has a very serious and methodical commitment to performance. We try really hard to make sure that every Vitess version is faster than the previous one. To ensure that we meet this commitment we have created a continuous benchmarking toolset named “arewefastyet”, inspired by performance tracking efforts of other open source projects such as Firefox and Rust.
How arewefastyet works #
Executing a benchmark against Vitess is not trivial: benchmarks can be unreliable and hard to reproduce. Let us discuss how arewefastyet achieves accurate and reproducible benchmarks at scale.
At the core of arewefastyet lies the execution engine. This engine is responsible for the entire lifespan of a benchmark run, which is the reason we call individual runs an "execution". An execution can be triggered from a variety of sources such as a manual trigger from the CLI, a cron schedule, or based on an event (new pull request, new release, etc). Triggering an execution results in the creation of a new pipeline, which is configured using a YAML file provided by the trigger. The YAML file contains the required configurations to run the entire benchmark, some of which define how to provision the benchmark’s infrastructure, store results, notify maintainers, and so on.
Each execution gets a dedicated server on which the benchmark is run. For the production deployment of arewefastyet, all the hardware used is provided by Equinix Metal. The default configuration uses m2.xlarge.x86 servers; these are bare-metal servers which greatly increase the reliability and accuracy of our benchmarks. The provisioning of an execution’s infrastructure is accomplished through the use of Terraform, which lets us manage the exact configuration of our servers in a reproducible manner. Once a server is provisioned, several Ansible roles are executed to apply dynamic configurations and settings on each instance, based on the benchmark we intend to run. Depending on the type of benchmark, the server is likely going to be configured differently.
For instance, a macro-benchmark needs to have a Vitess cluster created, whereas a micro-benchmark does not. Configuring a server implies installing required packages and binaries, tweaking hard drive and network settings, building the Vitess and arewefastyet codebases, and lastly setting up and deploying a Vitess cluster. The settings of the Vitess cluster are based on the configuration initially provided by the trigger. The default configuration measures Vitess' performance while using a sharded keyspace with six vtgates and two vttablets. Once an execution’s server is ready to be used, Ansible’s final task is to call arewefastyet’s CLI to start the actual benchmark run.
Micro benchmark runs #
Vitess is mostly written in Golang, and the Go standard library ships with a comprehensive testing framework which includes a micro-benchmarking toolset.
Along with the numerous unit tests in the Vitess codebase, we can also find a multitude of micro-benchmarks implemented directly in Go.
These micro-benchmarks are executed using the default go test runner by arewefastyet’s microbench command.
The results of these micro-benchmarks contain critical performance metrics such as: the number of nanoseconds per iteration, number of bytes allocated, etc.
We parse and analyze these values, and then we store them in a MySQL database, so they can be displayed later on.
Macro benchmark runs #
Whilst micro-benchmarks are great to measure the performance of functional units in our codebase, we need macro-benchmarks to give us a better understanding of the overall performance of the system. The setup of a macro-benchmark is, however, much more complicated since we want to reproduce an environment closer to what users will be running in their production deployments.
As mentioned earlier, we try to deploy a realistic configuration for our benchmark Vitess cluster, including: six vtgates, two vttablets, an etcd cluster, and a vtctld server. The actual benchmarking of a cluster is performed by a custom fork of sysbench, a highly configurable lua-based tool that is designed to benchmark arbitrary data stores. We divide the execution of every macro-benchmark run into three steps: preparation, warm-up, and the actual run. The three steps are executed one by one by arewefastyet’s macrobench command:
- The preparation step is meant to create all the required data and files on the Vitess cluster.
- The warm-up steps runs a small benchmark, which is then discarded.
- The run step starts the sysbench benchmark against the Vitess cluster.
Right now arewefastyet supports two different OLTP benchmarks, a simple one which we call "OTLP", and a more complex one named "TPC-C" which mimics a real world scenario where a wholesale supplier runs complex transactional queries. Once a macro-benchmark has run, we fetch the results generated by sysbench and store them in a MySQL database. These results measure the latency, and the number of transactions and queries per second (TPS and QPS).
In addition to the external measurements captured by sysbench we also keep track of the internal Vitess metrics exposed by the cluster and a wide variety of operating system metrics. To scrape and aggregate them, we start a Prometheus backend.
Metrics #
Once the benchmark has started, the metrics are funneled from our Prometheus instance to a centralized server where they are kept in an InfluxDB database. A Grafana frontend runs adjacent to the InfluxDB server and provides the maintainer team of Vitess with real-time dashboards on each execution. The number of metrics we can visualize is large, although the final report on the arewefastyet website focuses on two main measurements: CPU time and memory consumption. These are the two global system metrics which give us the most insight into the overall resource usage of Vitess. The number of supported metrics is not limited and meant to grow in the future.
Summary #
The following diagram summarizes the execution process:
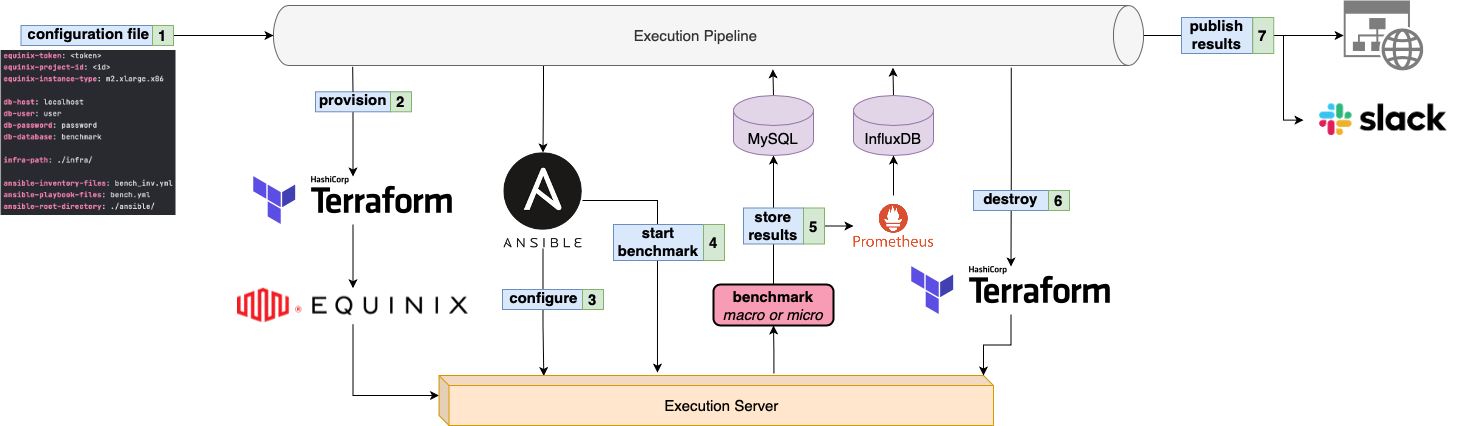
The link with Vitess #
In order to continuously benchmark Vitess, arewefastyet has several cron jobs configured to run daily.
These jobs take care of benchmarking the main branch, the release branches, tags, and PRs with the Benchmark Me label in the Vitess repository.
The results we get from these cron-triggered benchmarks are compared against previous benchmarks of the same type.
This allows us to catch any performance regressions as soon as they are merged.
We routinely run the following comparisons:
- Main branch against the previous day results on main branch.
- Main branch with the last release.
- Release branch against the previous day results on release branch.
- Release branch against the last patch release for that release.
- Pull Request against the base of the head of the PR.
After these comparisons, if we find that any of the results have regressed by more than 10%, we send a Slack message to notify maintainers about it.
Furthermore, we benchmark the performance of both query planners that Vitess has: the current v3 planner and the experimental, under-work, Gen4 planner.
With this, we are able to track the performance boost that Gen4 provides over the current v3 planner.
Website #
All the results accumulated through the cron jobs are available to be visualized and compared on the website arewefastyet. These are all the different views into the benchmark data that we currently make available:
Micro benchmark page #
This page can be used to compare the micro-benchmark results for all releases (after 7.0.0). They can also be compared against the latest results on main.
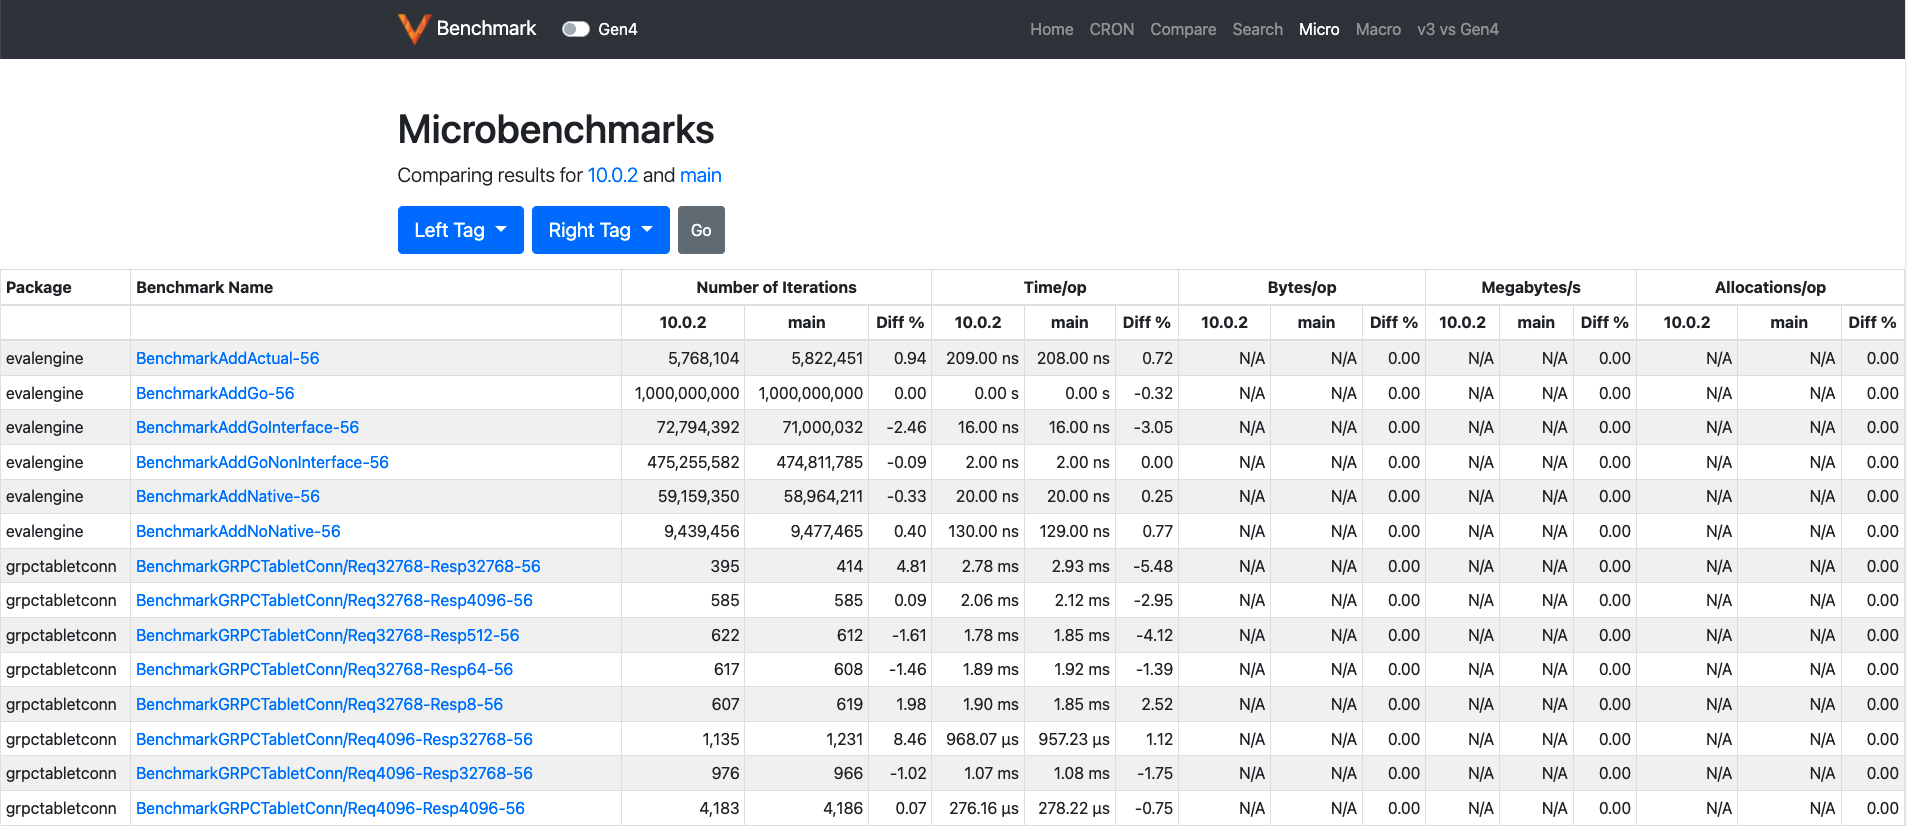
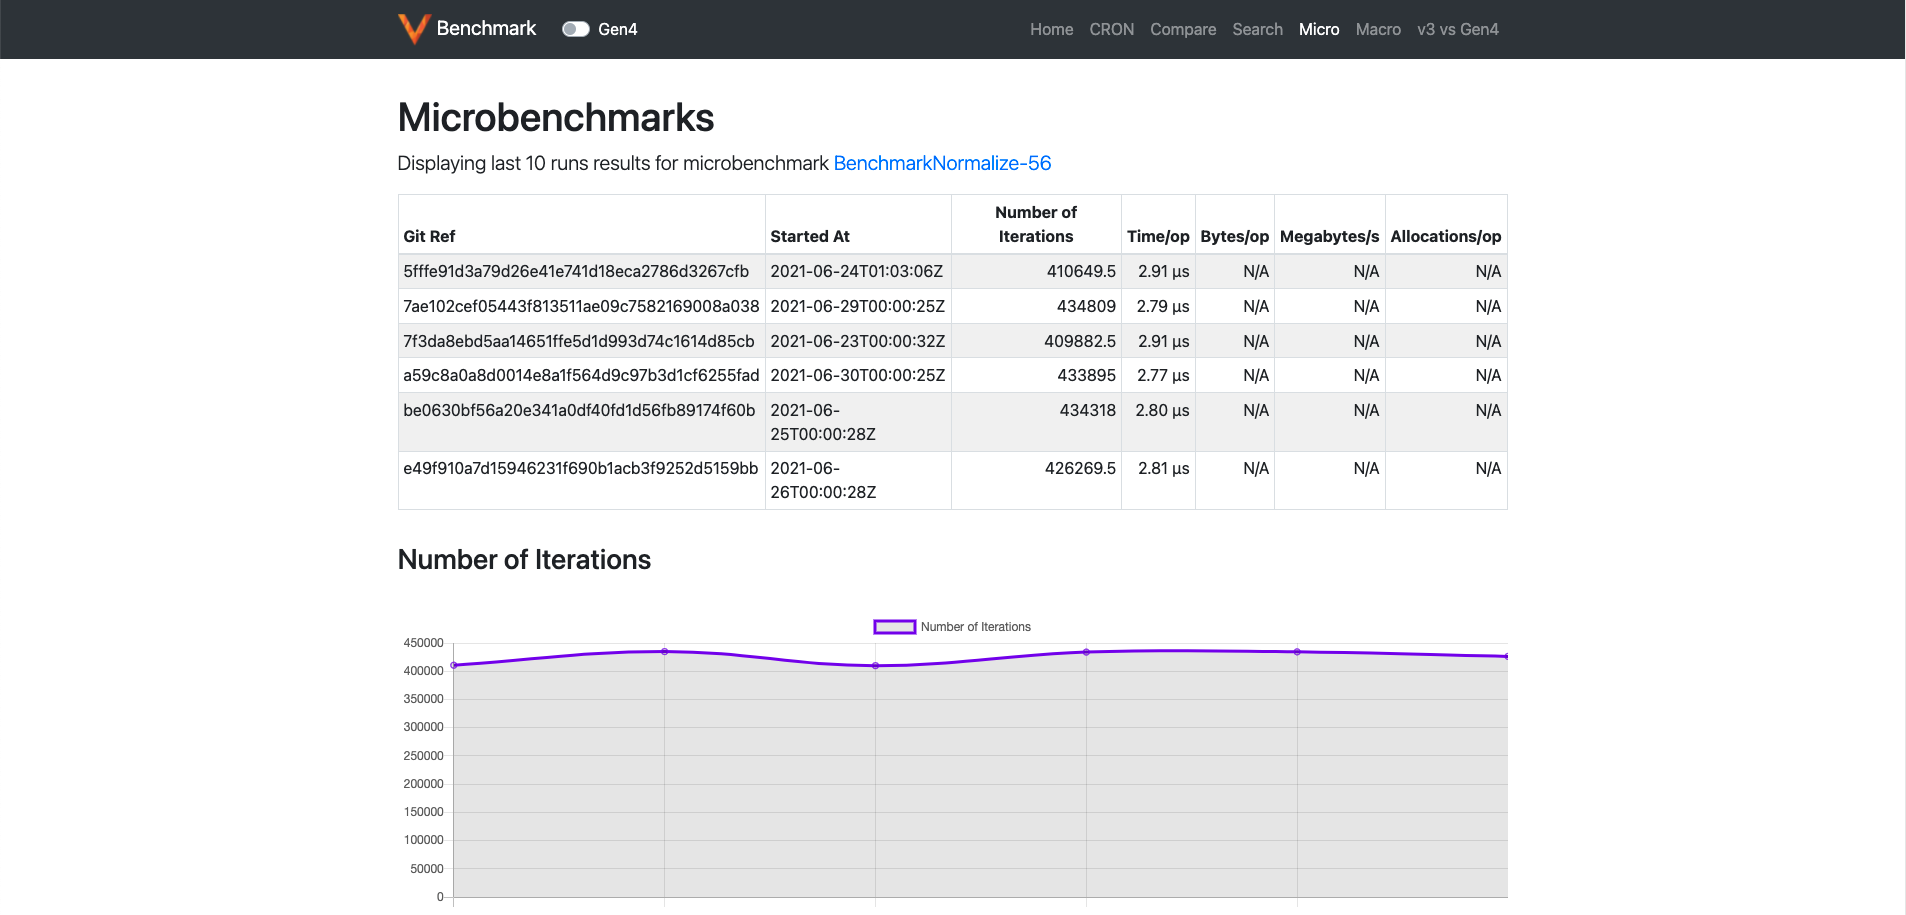
Clicking on any of the individual benchmarks opens up another page where we can see the results of that micro-benchmark over the past few days.
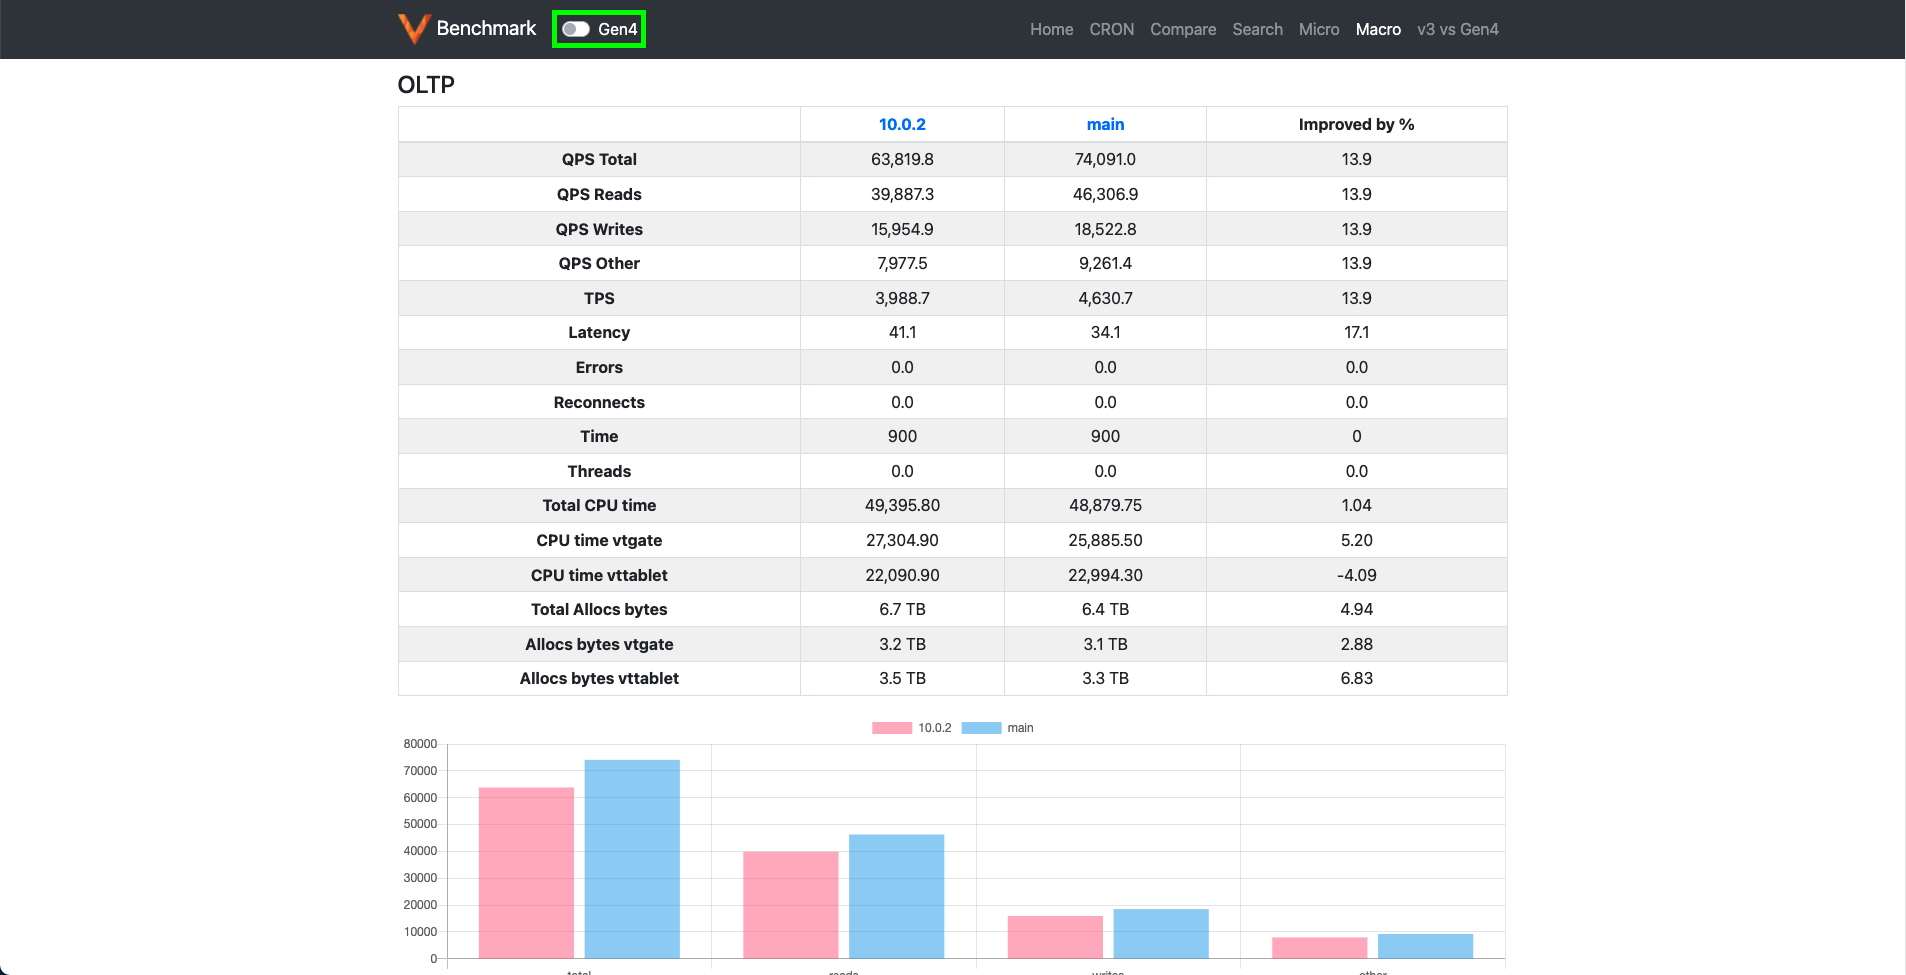
Macro benchmark page #
Like its micro-benchmark counterpart, this page also compares the results of all releases (after 7.0.0) and main on OLTP and TPCC benchmarks. The results of Gen4 planner can also be compared by using the toggle button in the menu bar (highlighted in the green box).
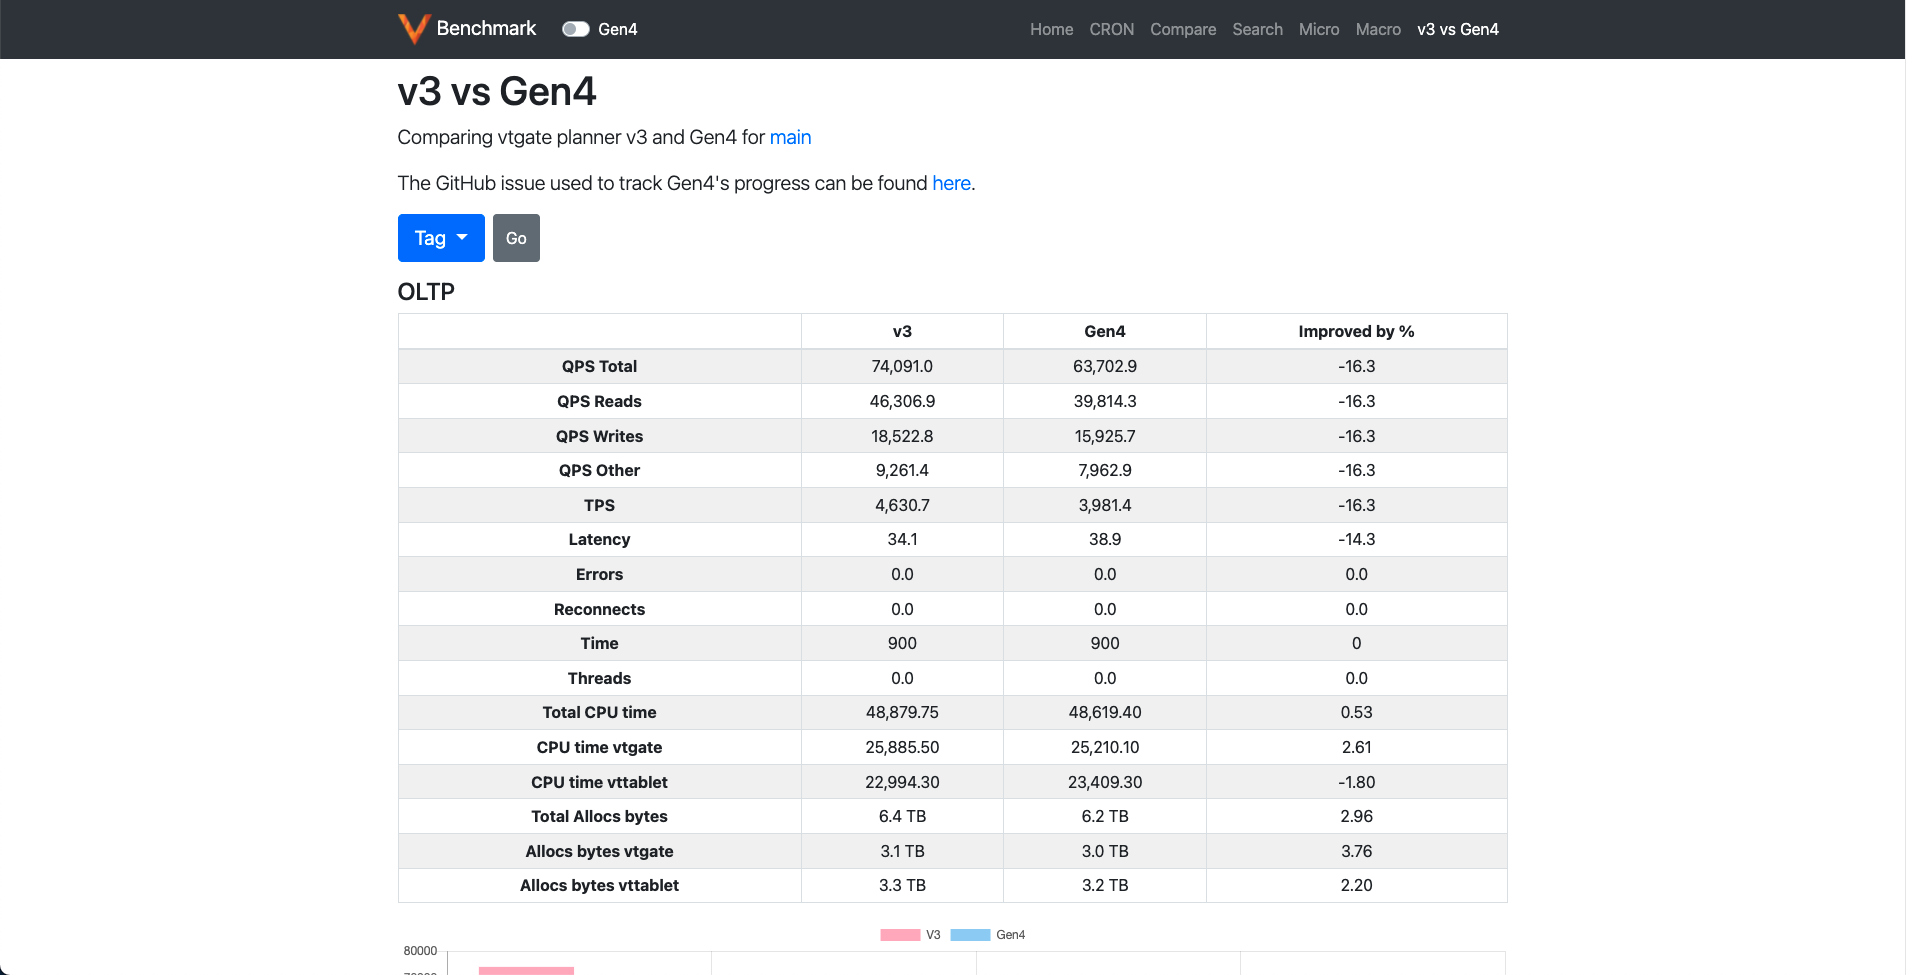
V3 vs Gen4 #
This page compares the performance of the v3 planner and Gen4 planner on all the releases after 10.0.0 in which it was introduced.
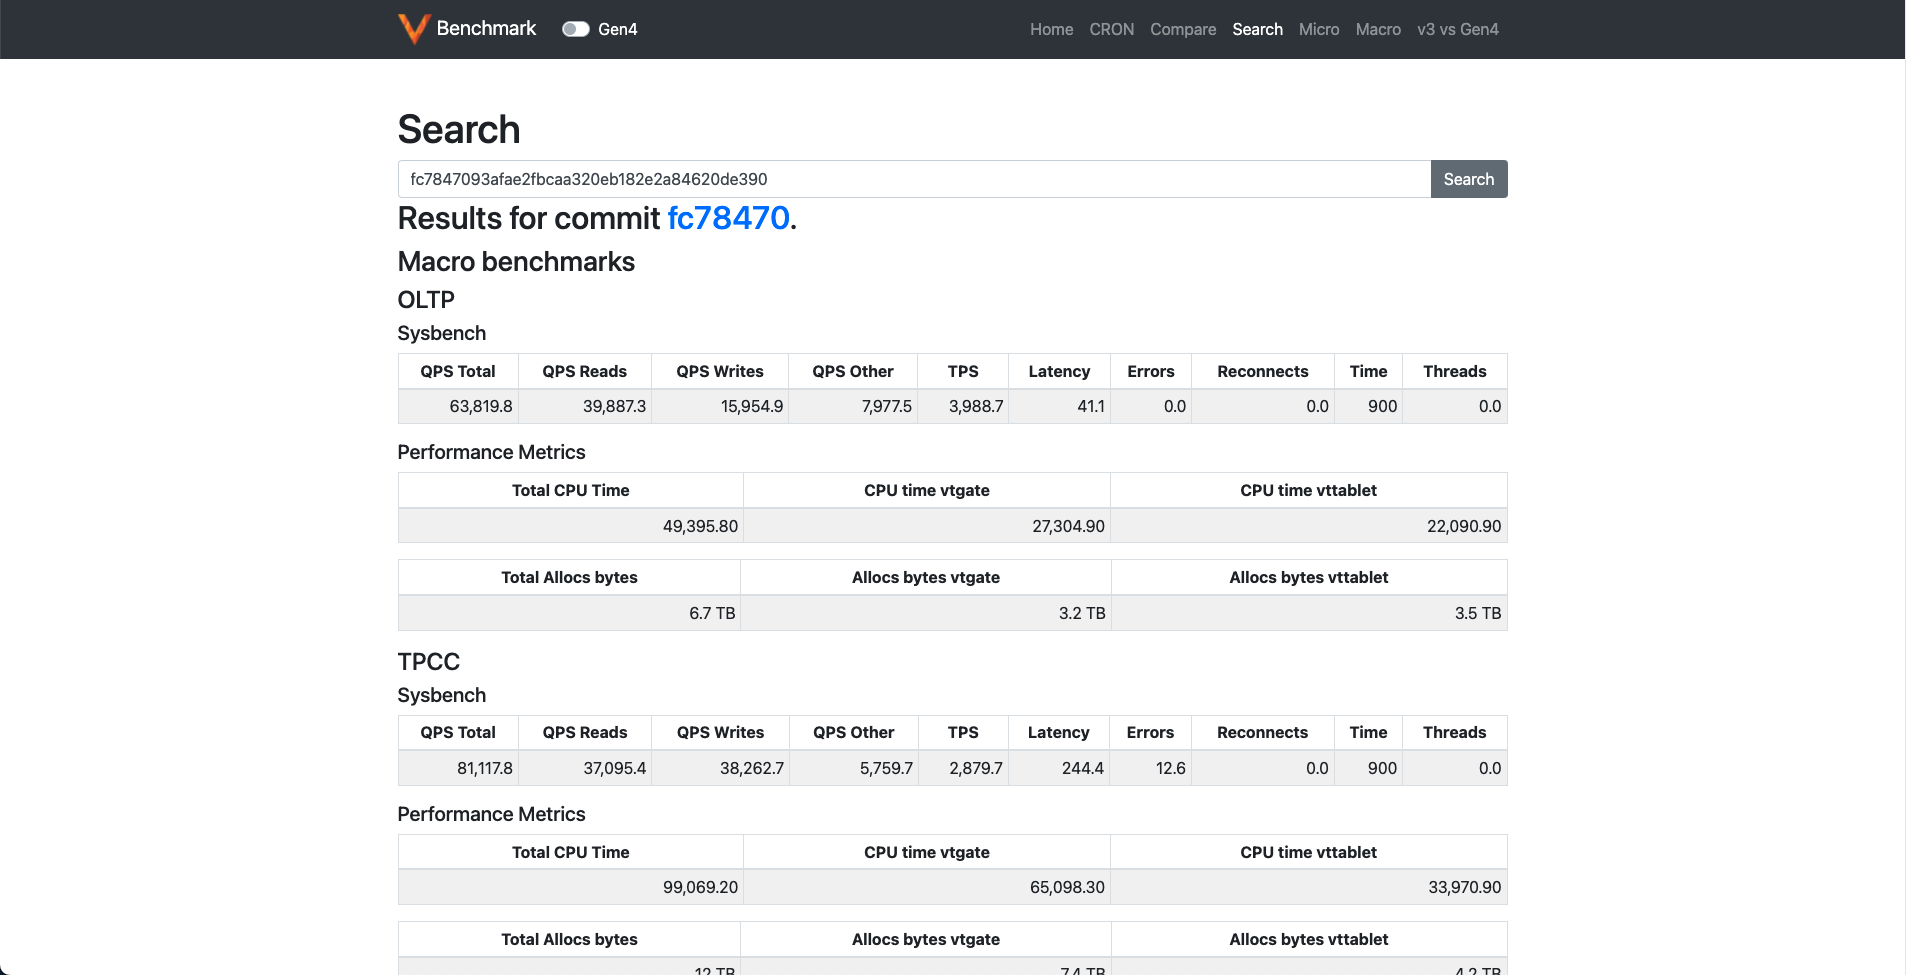
Search page #
This page can be used to check the results for a specific commit.
The functionality of the Gen4 switch button remains the same.
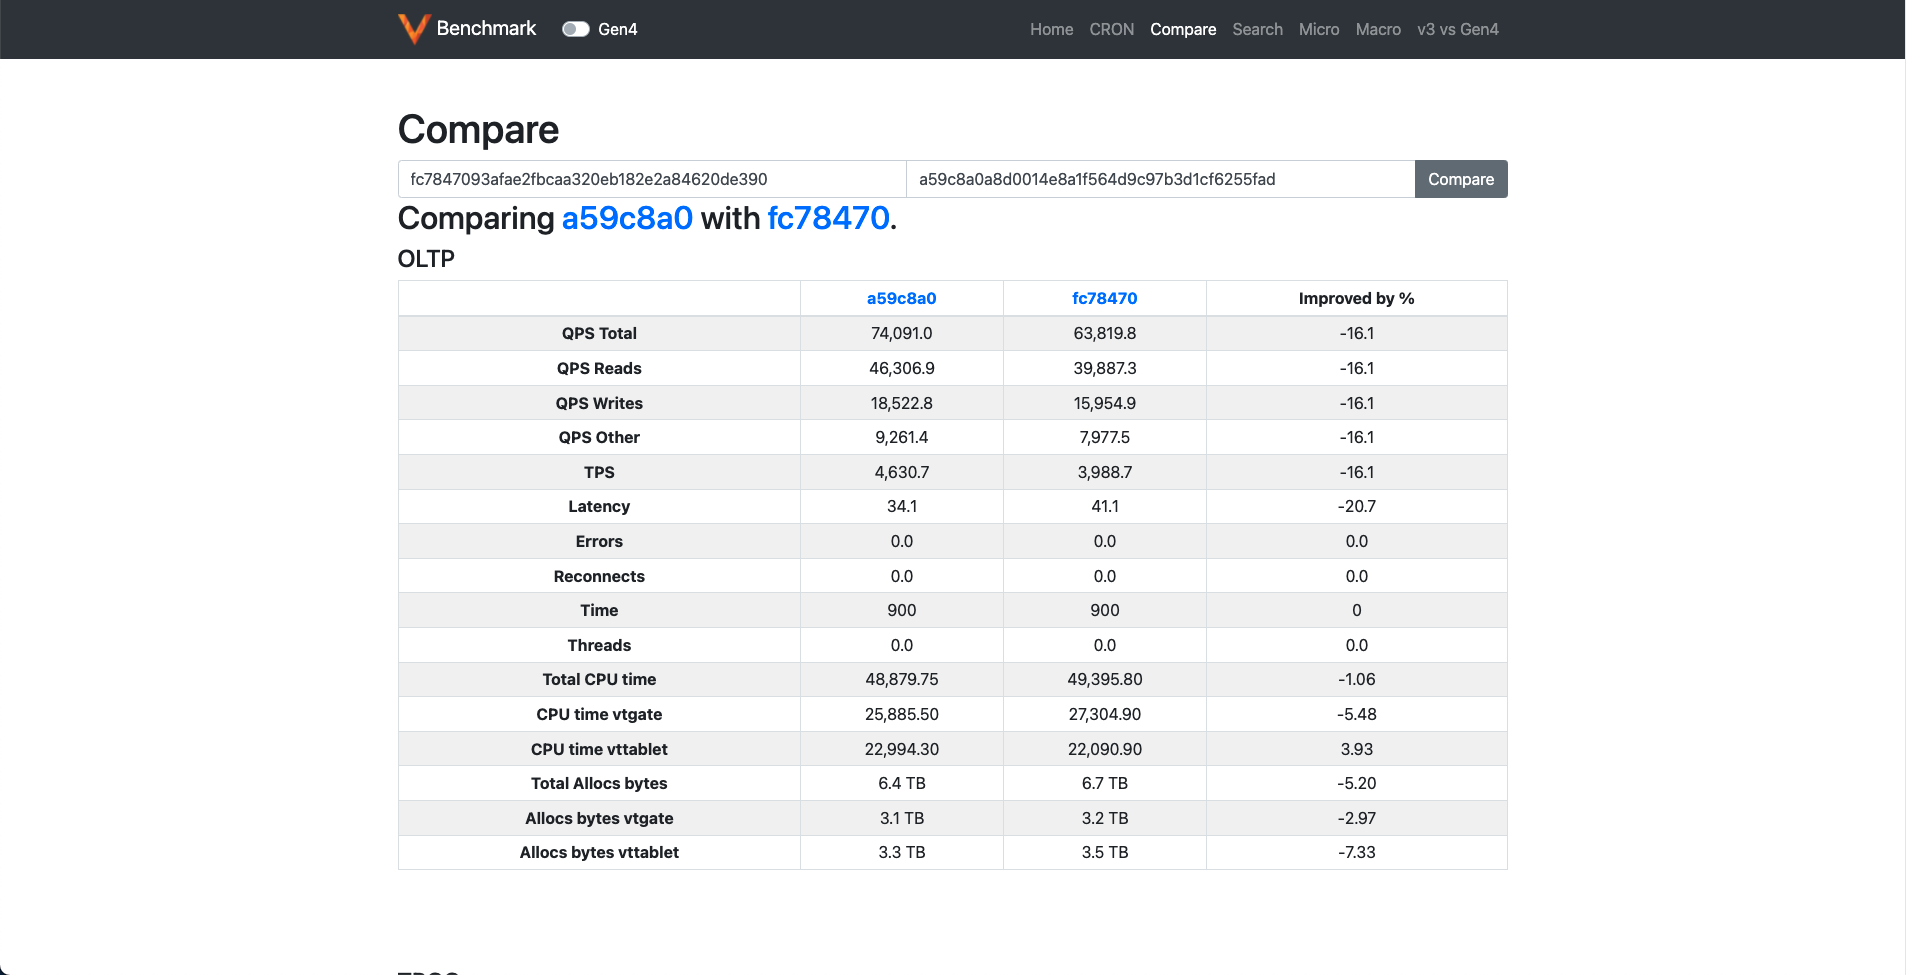
Compare #
This page is similar to the search page except that it compares the results of two commits.
Summary #
Vitess' arewefastyet is not the first continuous benchmarking tool for a major open-source project, but it is a rather unique one in that it runs and keeps track of both micro-benchmarks and end-to-end macro-benchmarks. We built arewefastyet to make it easier for users to migrate to newer Vitess versions while having confidence in their performance, and to help our maintainers make sure that no regressions are introduced between releases.
We will keep talking about Vitess' exciting performance journey in this blog in the future.